Post-mortem — how we rundown a CTF for 1167 participants
Context — the opportunity
To understand this post-mortem, you need to understand where we stood with Harem (our in-house CTF platform) before this event.
For 4 editions we've been running Hack'In, an annual CTF we put together with a bunch of passionate folks. Across those 4 editions: 500+ visitors, 350+ participants, 25+ sponsors, 150+ challenges created. Before 2024 we used CTFd and then CTFCafé, and we spent more time picking the platform up off the floor than taking care of our participants. Every edition ended with the platform down at 2am or 3am in front of 150 people.
In 2024 we decided to stop dicking around and code our own platform — Harem. We tested it on Hack'In 2025 (4.53/5 rating, 54 challenges, 0 technical issues), we used it in class with students, on youpwn.me, at small corporate events. Each time, maximum ~150 concurrent users.
Then, at the end of 2025, Ynov reaches out to organize an inter-campus CTF. One event, one day, 1167 registered students, spread across a dozen campuses in France — Toulouse, Bordeaux, Aix, Paris, Nantes, Rennes, etc. The biggest campus alone is 33 teams of 5, so 165 participants.
This is the opportunity we'd been waiting years for.
- Technically: it's the first real load test of Harem. If the platform holds, we prove we can scale 10x the size of event we'd handled so far. It's the validation that we're aiming at a market above small association CTFs.
- Strategically: it's our first big event with a real contract. If it goes well, it opens the door to other similar events — universities, schools, companies. Concretely, it's the first serious euro for Harem, after 2 years spent developing the platform on our own dime.
- Symbolically: for us, it's the first time Harem leaves our ecosystem (Hack'In + classes) to be used by people who don't know us. It's the moment we stop running Harem in a friendly setting and put it in front of users who don't care about our history.
Suffice it to say the pressure was enormous. For an event of this magnitude, it's not enough that "most things work". Everything has to work, for everyone, for 8 hours.
Introducing Harem
For context, you should know that this CTF platform is 100% developed by us, 0 third-party frameworks, 0 CMS, 100% homemade code. For better and for worse.
Our tech stack is: a terraform "worker" that manages the VMs, a Node.js backend, a MongoDB database, a React frontend, an internal Traefik reverse proxy and a frontal Nginx reverse proxy, all hosted on GCP across two different projects. The first one hosts the VMs and the other hosts the platform and the SuperMeeee challenge.
The entire infrastructure is containerized in a docker-compose, we drop it on a huge VM, we run docker compose up --build and everything works as code and automatically. That is:
- Creation of users/teams/roles/etc.
- Provisioning of VMs in GCP, GCP firewall setup, IP management, etc.
- Scraping of challenges on github
- Pre-build and pre-pull of all github images on each VM
- Preparation of SSH accounts, keys, monitoring, weird configs for weird challs
- Validation of challenges to NOT push challenges that don't work (malformed flag, missing resources, etc.)
- Mapping of teams to VMs based on limits
- …
In short, there's a .env to provide and once the containers are up, that's it. No more human intervention needed.
Note that this wasn't the first time we deployed our platform at a CTF. Not the first, not the second, not the third time.
We had also organized a CTF on November 27 for about a hundred people to test a bunch of challenges we were going to offer to participants.
One point that matters: we had NEVER had a single second of downtime on the platform before that day.
So very naturally we told ourselves that even if 100 people isn't 1000, we'd just 12x/13x the resources and we'd be WAY IN THE CLEAR because for 100/150 we always provisioned 4 times too much. But if you're reading this, you can already guess how the story goes 🤡

NB: You can find the article
Welcome in our Haremon the blog which presents the platform in its current state and the reasons we use it.
December 3 — Day -1
On December 3, registration emails have been going out for several days to the 1167 people expected on the platform.
At this point we've already solved all the challenges on the platform several times, on several VMs, everything works and we think we're ready.
As early as 9am some participants start fuzzing the platform with tools like feroxbuster and gobuster.
And there, our VM with 16 vCPU and 128 GB of RAM is showing a 502. So right there we're saying to ourselves it's REALLY not normal that someone can bring down such a big machine with just a scan.
So we reproduce on our end and prepare load tests. We run between 800 and 3700 req/s. And it crashes.
We then set up a rate limit (we chose to use our nginx and not add cloudflare or Google's service for many reasons) and we add this to our config:
# Zone for the API: 600 requests/second per IP with queue of 300
limit_req_zone $binary_remote_addr zone=api_limit:10m rate=600r/s;

# Zone for the frontend: 200 requests/second per IP with queue of 100
limit_req_zone $binary_remote_addr zone=general_limit:10m rate=200r/s;

# Map to detect bruteforce/scanner tools
map $http_user_agent $is_scanner {
    default 0;
    ~*feroxbuster 1;
    ~*gobuster 1;
    ~*dirb 1;
    ~*wfuzz 1;
    ~*nikto 1;
    ~*sqlmap 1;
    ~*nmap 1;
    "" 1; # Empty User-Agent = suspicious
}

location /api {
    # Rate limiting with queue for normal clients
    # Without nodelay = requests are queued and processed progressively
    limit_req zone=api_limit burst=300;
    limit_req_status 429;

    # For detected scanners, block requests
    if ($is_scanner) {
        return 403;
    }
    ...
}

location / {
    # Rate limiting with queue for the frontend
    limit_req zone=general_limit burst=100;
    limit_req_status 429;
    ...
}
It works, now a student can block their entire campus but won't be able to crash the machine (barring significant means).
Except at this point we also take the risk of blocking legitimate calls.
We then calculate the number of requests made when calling a page of our front. Overall there's the front that makes several calls to build itself (css, image…) but nothing too heavy, then per page viewed we have on average 5 calls to our backend.
We take the campus with the most teams, Toulouse with 33 teams, there are 5 participants per team, we do 33x5 so 165 students. We assume they'll all refresh at the SAME second (highly improbable) and we do 165x5=825. So to handle this "legitimate" flow we budget 900 connections per campus (rate+burst).

After that we test from several IPs, we go up to 3700 req/sec per IP and as soon as we connect with another IP, no bug, everything is super smooth.
We also bump the machine's specs to double the number of CPUs, going to 32 vCPU and 128 GB of RAM, figuring that for 1500 people it should be more than enough because it's still just a webapp!
December 4 — Day 0
Around 00:03 we deploy all the VMs on the project set up for them, and that's when we discover that literally at the same moment Google MASSIVELY increases our quotas on that VMs project (the project matters). For info, we've been begging Google for 4 months to get at least 15 public IPs and Google was blocking us at 15, so. When we discovered this, we'll let you imagine the reaction.
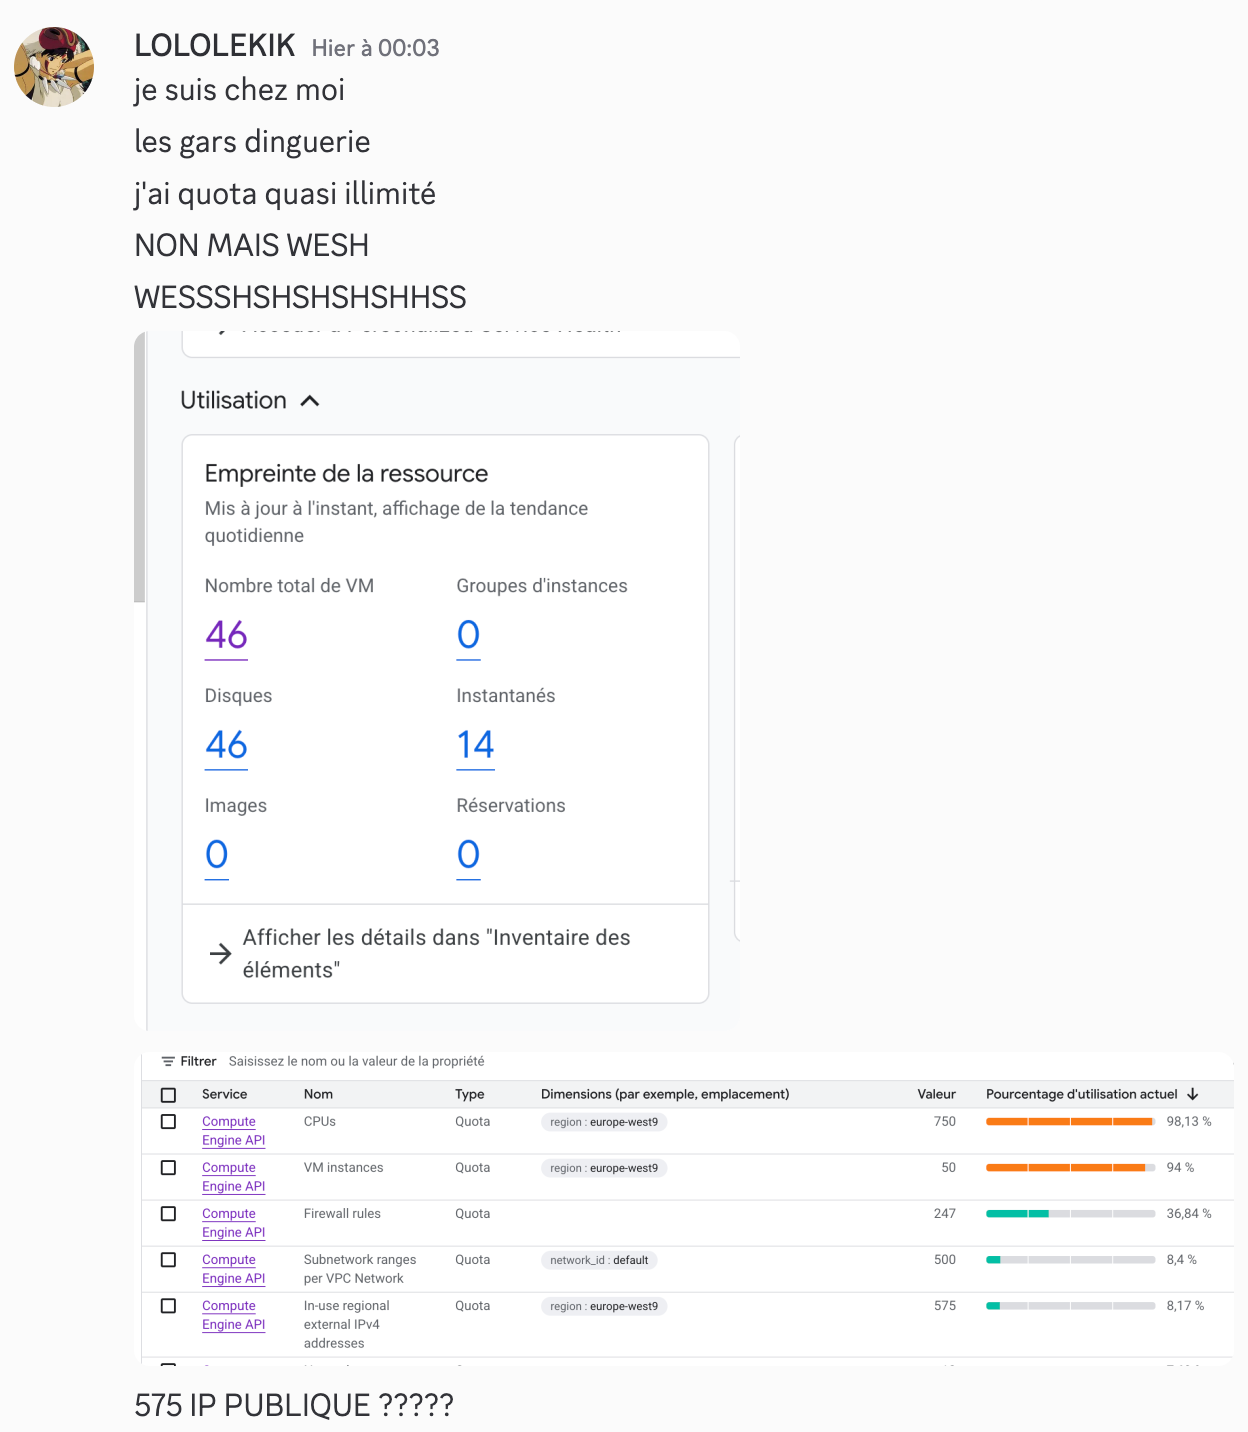

We had not been warned by Google because we had to cry to some support guy — long story.
We then deploy 50 VMs of e2-standard-8 (8 vCPU, 32 GB of memory), we build all the challenges on them and assign 4 teams per VM. And it doesn't even use half of our quotas.
We'll also skip the part where an RCE dropped on our stack because it doesn't matter for this post-mortem. In any case the whole team slept less than 3h that night.
We arrive at Ynov at 8:30am and here's our hope in the moment:

So, 9:15 and there, 0 challenges, the front works but 0 challenge.
We see we have 0 response from the backend. It can't be our container management because the participants didn't even have access to the challenges. The backend just can't hold the load. That's our first conclusion.
We look at our htop on the machine and we see we have 1 GB of RAM used and, ok, our CPUs are consuming a bit but they're not maxed. So performance-wise we seem fine.
We tell ourselves it's a problem we'll fix in 5-10 minutes. If performance is good, then it's the backend-side rate limiting that isn't keeping up.
We change the nginx config to something more permissive:
limit_req_zone $binary_remote_addr zone=api_limit:10m rate=900r/s;
limit_req_zone $binary_remote_addr zone=general_limit:10m rate=400r/s;

location /api {
    limit_req zone=api_limit burst=600;
    limit_req_status 429;
    ...
}

location / {
    limit_req zone=general_limit burst=300;
    limit_req_status 429;
    ...
}
Still KO, so we tell ourselves there's a bottleneck so we test a ton of stuff, we limit the rate, we increase the burst then the opposite then we remove the limits.
And there, still nothing. Until 9:30 we make the same changes in loops for the same results (Einstein's definition of insanity).
And it's almost instantly a white page. We literally have 0 indicator in the red.
1st takeaway: monitor a MAXIMUM of indicators.
And there, until 9:35, it's a total void, it's literally IMPOSSIBLE to know, especially in the urgency. We had ideas for fixing the problem or investigating. Except in our heads it absolutely had to be fixed within 5 minutes (or 5 minutes ago). And it's after those 2/3 minutes of total void that we told ourselves we had to do something and that we'd spin up an instance. Even if from our point of view it wasn't a perf problem (which is why we hadn't done it from the start) we at least had to try stuff.
2nd takeaway: don't hesitate to kick off a "long" resolution mode from the very start, in case you don't fix everything in 5 minutes.
Last thing: we could have increased the resources of our platform, except the platform is not in the zone with the increased quotas. And in that zone we were already at 100% CPU. And then we remembered that Google gave us near-unlimited quotas on our other project. Except you can't easily migrate a VM from one project to another, and we had tested this less than a week earlier.
So we switch projects, we pick the VM that seems the most overkill to us.

We take an n2-highmem-64 (64 vCPU, 512 GB of memory) and there it's impossible to create it. We had reached our max number of VMs on the project (we were still at 50). So we delete a random VM telling ourselves it would only impact 4 teams but that it could save everyone. So apologies to the following teams who had to wait even LONGER than the others to be able to start:
- BOR7
- AIX16
- PAR21
- NAN4
And there it's off to the races at 9:35:52, we start redoing from SCRATCH everything we had prepared. Including doing things we hadn't planned like exporting the whole DB to switch it over to the other instance, because we couldn't just repopulate the users otherwise everyone would have lost their password etc.
3rd takeaway: prepare emergency backup scripts and pray you never need them.
Because it wasn't just spinning up a new platform, everything had to be IDENTICAL to the old one to keep using all the provisioned VMs with the right SSH keys, github tokens, etc.
So:
- 9:35:52 — VM creation
- 9:38:54 — Fetching all our platform code from our github
- 9:41:30 — Installing prerequisites like docker
- 9:42:24 — Validation of new certificates for ynov2
- 9:59:56 — Retrieval and repopulation of the entire old DB
- 10:03:37 — 200 code on the platform and confirmation that it works
- 10:04:?? — Start of communication on the ynov2.hackin.fr discord
- 10:05:21 — First flag validated by victor-w-REN
- 10:05:?? — Platform down
We had just spent 30 minutes redeploying everything identically and in less than ONE minute we find ourselves in the exact same situation as before.
We then go back over our architecture and here are the conclusions we can draw about the services:
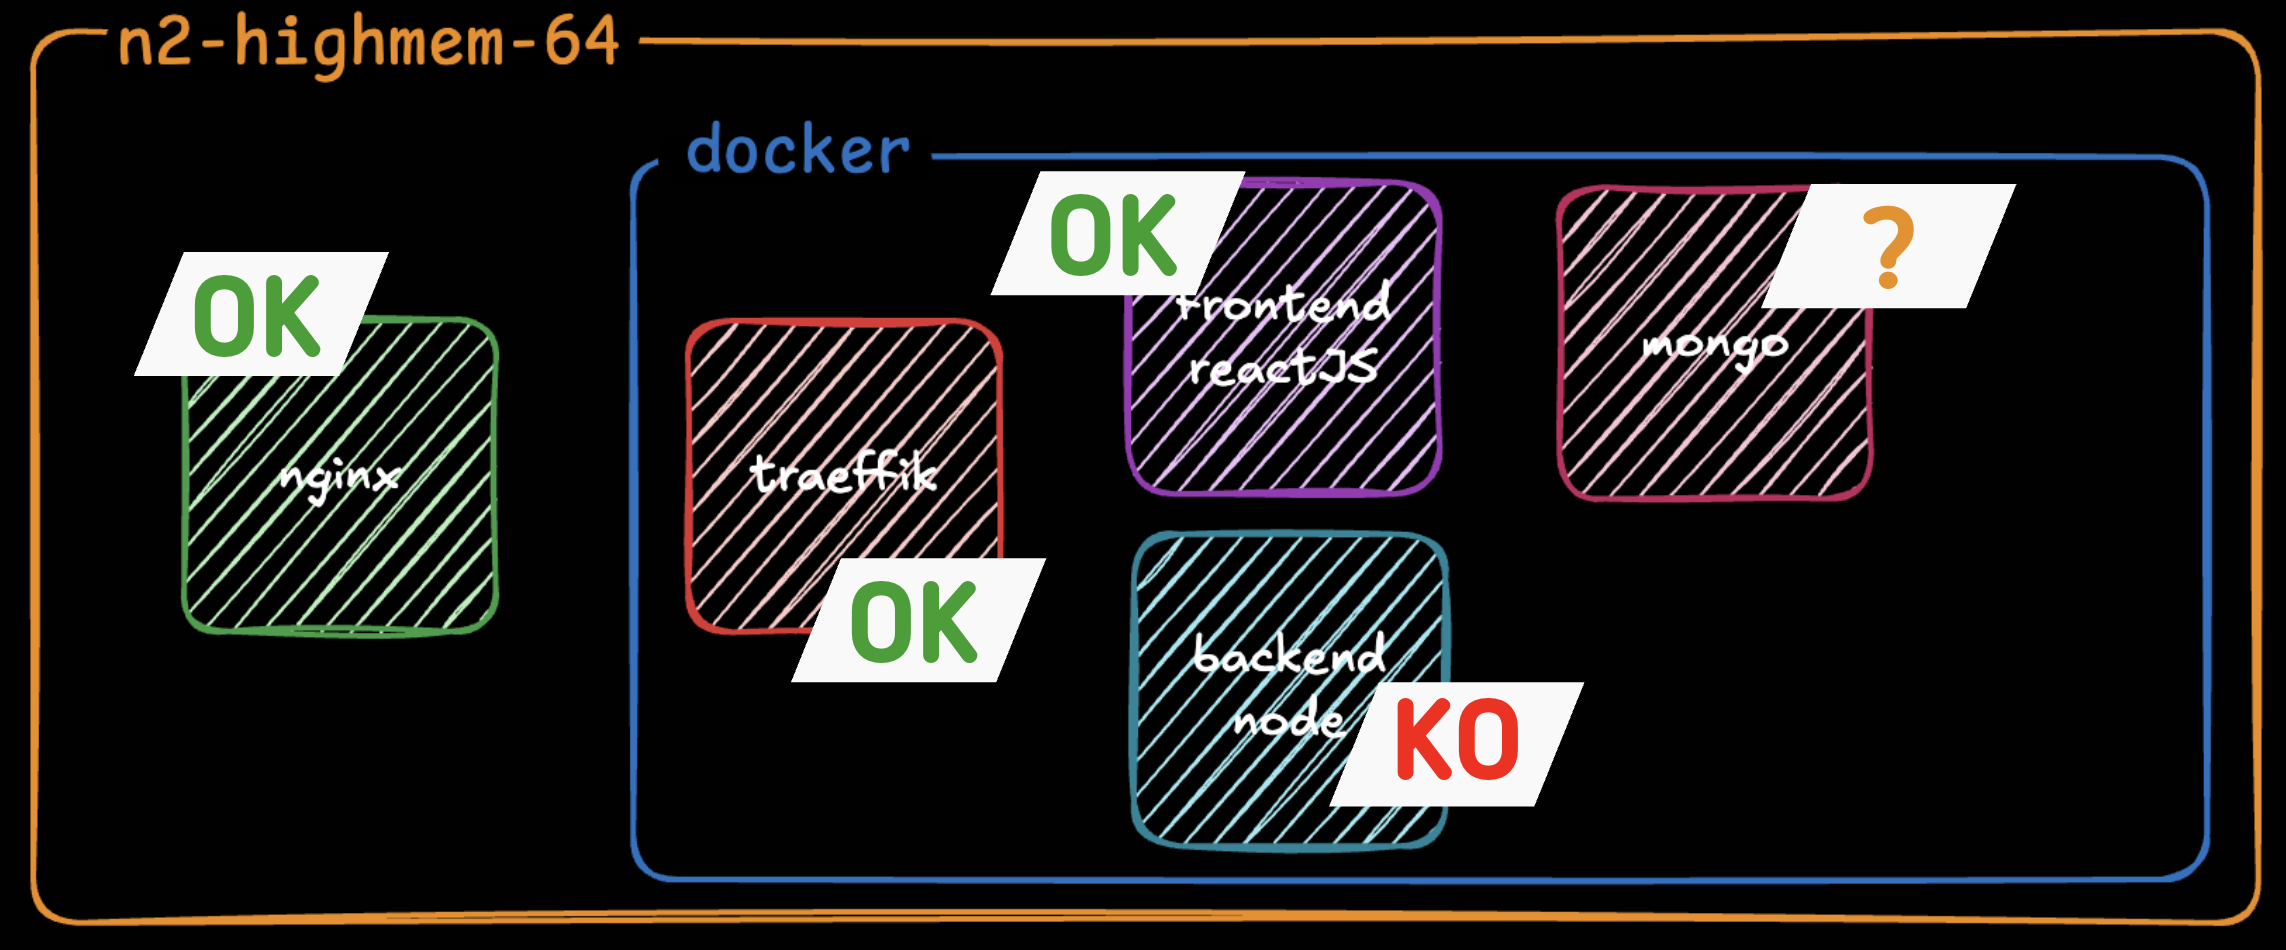
We don't know what state our DB is in but in any case we are SURE our backend is not responding.
We look at our htop again, and the obvious is still the same. Our containers are NOT using our VM's resources.
But this time it appears more clearly. We have one CPU that's at 100% usage and all the others barely used.
Yet in our docker-compose.yml we don't specify any limits on resource usage. So we head in the direction of setting limits, but huge ones, to see if it unblocks the containers and forces CPU usage.
Here are the commits made:
- 10:13:13 — KO
- 10:15:06 — KO
- 10:16:09 — KO
- 10:30:53 — KO
- 10:36:07 — KO
- 10:38:31 — KO
- 10:39:57 — KO
- 10:42:29 — KO
- 10:43:30 — KO
- 10:43:52 — KO
- 10:45:26 — KO
- 10:46:59 — OK
We tested a dozen configurations in total to get it working. Here's what really changed everything.
The solutions put in place
First, you need to know that Node.js is single-threaded. So we started by implementing a node cluster that would let us create several processes running on different CPUs. We were finally going to let our application use the resources we were giving it. Here's the implementation:
const cluster = require('cluster');
const os = require('os');
// Use the environment variable or the number of available CPUs
const numCPUs = parseInt(process.env.NODE_CLUSTER_WORKERS) || Math.min(16, os.cpus().length);
if (cluster.isPrimary) {
  console.log(`Primary process ${process.pid} is running`);
  console.log(`Starting ${numCPUs} workers...`);
  // Fork workers
  for (let i = 0; i < numCPUs; i++) {
    const worker = cluster.fork();
    console.log(`Forked worker ${worker.process.pid}`);
  }
  cluster.on('exit', (worker, code, signal) => {
    console.log(`Worker ${worker.process.pid} died (code: ${code}, signal: ${signal}). Restarting...`);
    const newWorker = cluster.fork();
    console.log(`New worker ${newWorker.process.pid} started`);
  });
  // Log worker events
  cluster.on('online', (worker) => {
    console.log(`Worker ${worker.process.pid} is online`);
  });
  cluster.on('listening', (worker, address) => {
    console.log(`Worker ${worker.process.pid} is listening on ${address.address}:${address.port}`);
  });
} else {
  // Worker process - start the app
  require('./app.js');
}
Then we start our application with:
node ./src/cluster.jsNext we added connection options for our mongo database:
const connectDB = async () => {
  try {
    const options = {
      maxPoolSize: 100, // Maximum number of connections in the pool
      minPoolSize: 10, // Minimum number of connections in the pool
      maxIdleTimeMS: 30000, // Close connections after 30 seconds of inactivity
      serverSelectionTimeoutMS: 5000, // How long to try selecting a server
      socketTimeoutMS: 45000, // How long to wait for a socket to be available
      bufferMaxEntries: 0, // Disable mongoose buffering
      bufferCommands: false, // Disable mongoose buffering
    };
    await mongoose.connect(mongoURI, options);
    console.log('MongoDB connected');
  }
  ...
}
Unfortunately we think these options could have been significantly improved. They were probably too restrictive but every time we modified them (including the maxPoolSize) we got the impression the platform slowed down even more. So we left it like this but there's clearly room for improvement.
We also tried to improve our traefik to have it accept slightly longer backend response times without dropping connections, and we also added a limit on concurrent requests. Because if the backend takes time to respond we didn't want to keep overloading it. Here are the options added:
traefikhackin:
  image: traefik:latest
  container_name: traefikhackin
  command:
    - "--api.insecure=true"
    - "--providers.file.directory=/etc/traefik/dynamic"
    - "--providers.file.watch=true"
    - "--entrypoints.web.address=:80"
    - "--entrypoints.web.transport.respondingTimeouts.readTimeout=300s"
    - "--entrypoints.web.transport.respondingTimeouts.writeTimeout=300s"
    - "--entrypoints.web.transport.respondingTimeouts.idleTimeout=360s"
    - "--entrypoints.web.http2.maxConcurrentStreams=1000"
    - "--log.level=INFO"
    - "--accesslog=true"
    - "--accesslog.bufferingSize=100"
And finally we explicitly reserved space for our services in the docker-compose:
backendhackin:
  build:
    context: ./backend
    dockerfile: Dockerfile-prod
  container_name: backendhackin
  deploy:
    resources:
      limits:
        cpus: '48.0'
        memory: 96G
      reservations:
        cpus: '16.0'
        memory: 32G
  ...

mongohackin:
  image: mongo:latest
  container_name: mongohackin
  deploy:
    resources:
      limits:
        cpus: '32.0'
        memory: 400G
      reservations:
        cpus: '16.0'
        memory: 200G
mongod
--wiredTigerCacheSizeGB=300
--wiredTigerCollectionBlockCompressor=snappy
--wiredTigerIndexPrefixCompression=true
--logRotate=reopen
--logappendWith all these modifications, participants were able to start accessing the platform and launching challenges as of 10:46:59. So 1h30 late.
4th takeaway: for production, it's better to CLEARLY specify the resources you want your application to use, rather than letting it consume "what it needs".
Rest of the day

After that we thought we were done, except that at break time (we don't know why at that moment) the platform started going down again. So we pushed two modifications at 13:16:47 and 13:20:09 playing with the parameters above to try to find a balance.
Starting at 1:30pm the leaderboard would no longer display for anyone. And challenges were getting harder and harder to obtain. We assumed it was because the database was misconfigured and couldn't handle the large amount of data. Indeed in our database we don't have a leaderboard table that's updated on every solve. But we have users who have lists of completed challenges which themselves are worth points, but which are degressive based on other solves, etc. Consequently there are many queries to be made in DB to manage all the information. And it's enough for a single one to fail (because no more pool available or whatever) and it becomes impossible to get any information. So we custom-built a retry system to replay queries that had failed. Here's the piece of code in question:
async function retryMongoOperation(operation, maxRetries = 3, delay = 1000) {
  let lastError;

  for (let attempt = 1; attempt <= maxRetries; attempt++) {
    try {
      return await operation();
    } catch (error) {
      lastError = error;

      const isMongoConnectionError =
        error.name === 'MongoPoolClearedError' ||
        error.name === 'MongoNetworkError' ||
        error.code === 'EPIPE' ||
        error.message?.includes('connection') ||
        error.message?.includes('socket') ||
        error.message?.includes('closed');

      if (isMongoConnectionError && attempt < maxRetries) {
        const waitTime = delay * attempt; // Exponential backoff
        console.log(`MongoDB connection error (attempt ${attempt}/${maxRetries}), retrying in ${waitTime}ms...`);
        await new Promise(resolve => setTimeout(resolve, waitTime));
        continue;
      }
      throw error;
    }
  }

  throw lastError;
}
module.exports = { retryMongoOperation };
We had a lot of trouble getting this feature to work and had to do several pushes, but once it was done we were able to survive the rest of the day.
We redeployed the code at:
- 12:53:01
- 13:00:19
- 13:03:45
In total we tested and rebuilt our code in production 17 times and redeployed the platform on ynov2.hackin.fr 25 times.
The worst part of it? Our peak RAM was at 5.89% of its maximum capacity at 13:22:00 and our peak CPU usage was at 42.34% at 17:02:00.
We also had 363 tickets opened and €874.75 of GCP spend in 12h.
Conclusion
In conclusion what hurt us was neither security, nor bandwidth, nor underestimating the load we were going to receive. But rather the poor resource management by our codebase.
In the end it's not enough to just grab a big machine to run an application — what matters is that the codebase knows how to use its resources!
On the opportunity side, and this is the part you can't put on a graph: we still held. The competition happened, participants got to play, laugh, flag, complain, win. And the following edition (Hack'In 2026) hit 4.90/5 platform satisfaction — with these learnings baked in. A partial failure at 1h30, but a maturity gain we would never have gotten at 150 people.
I hope this article taught you a few things. We certainly learned a lot, and we now know the direction to take to improve our platform.